COVID-19 Online VIsualization Collection
COVIC Is
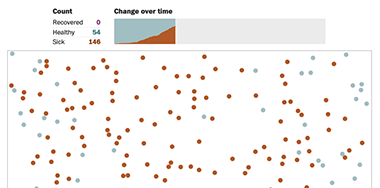
a broad multi-lingual, multi-cultural view of visualizations created during the global COVID-19 pandemic.
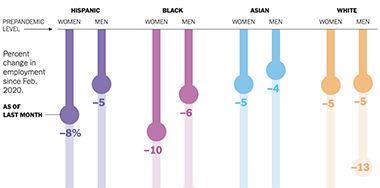
Classifies
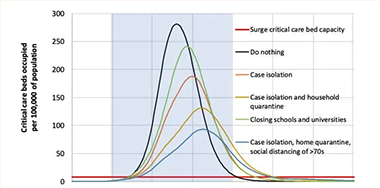
articles and figures in a format that is available for teaching and research purposes.
Contains
a snapshot of information design practice during the pandemic period.
Illustrates
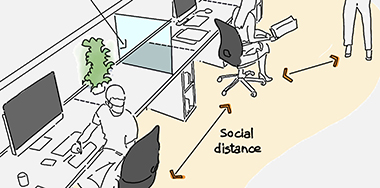
the range of qualitative and quantitative visualization possibilities.
Preserves
a persistent record of ephemeral online visualization artifacts.

Provides

a portrait of this moment of inflection accelerating the transition from print to online.
Represents
both a problem space — how can visualization practice be used to address this problem — and a solution space — the techniques being used at different times, in different languages, in different contexts.
